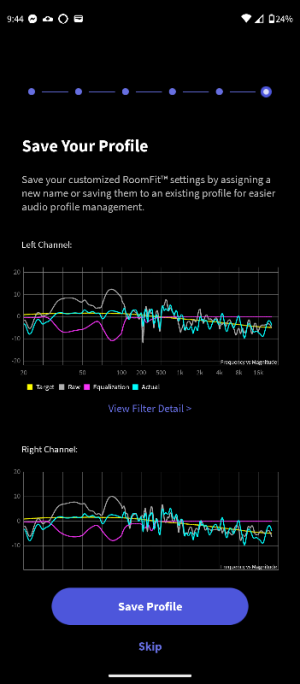
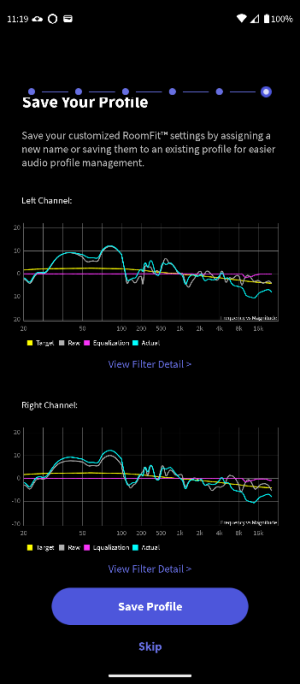
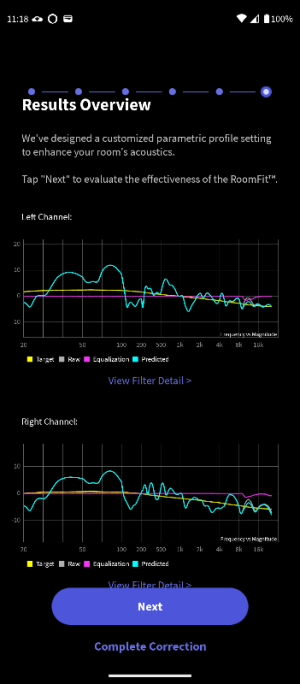
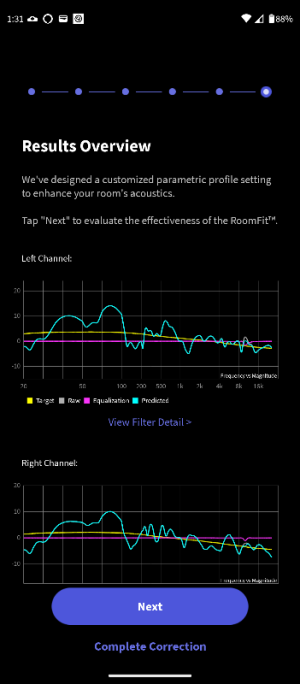
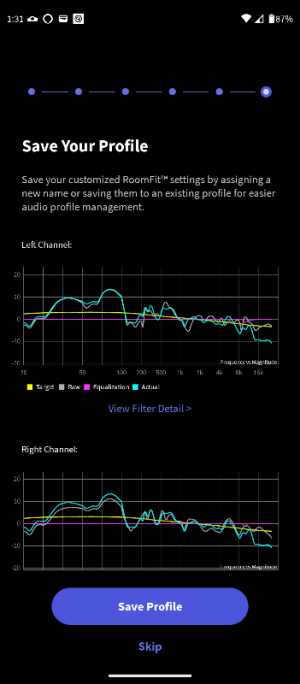
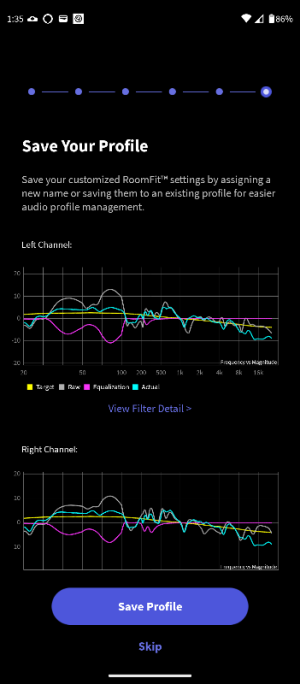
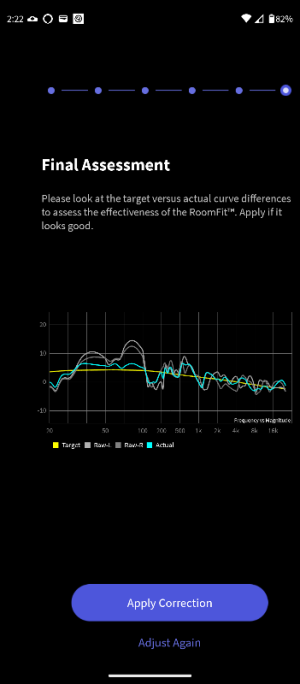
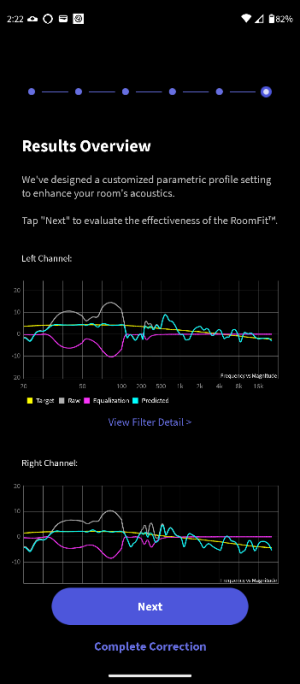
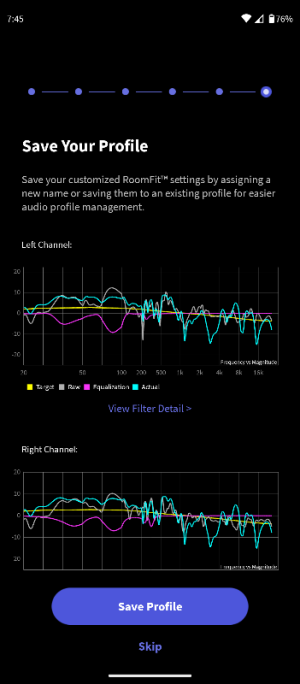
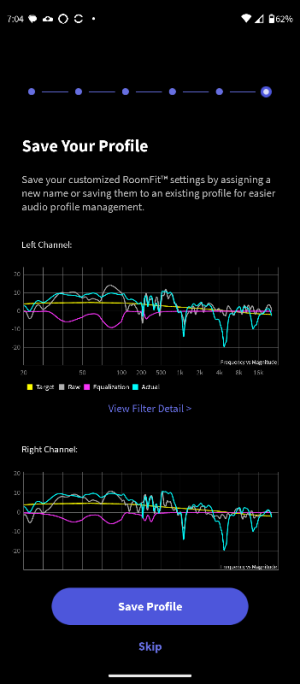
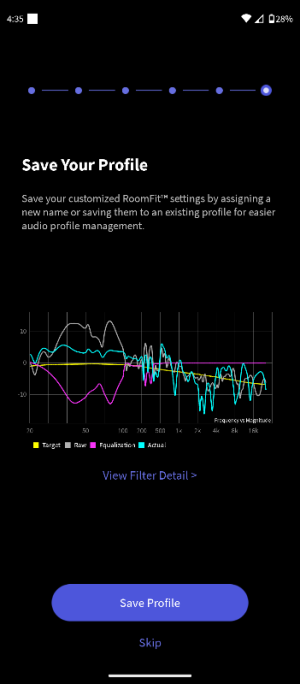
I don't understand why I see large dips (~around the 3-4k) in the verification 'actual' response? I apply correction up to 400hz so i thought the before and after would be similar above that freq. I see them in both individual and stereo measurements. I tried q3 and q10, crossovers 70,90,100,120. Any suggestions?
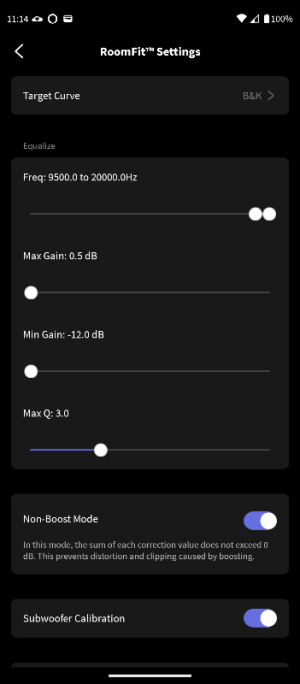
Roomeq Settings:
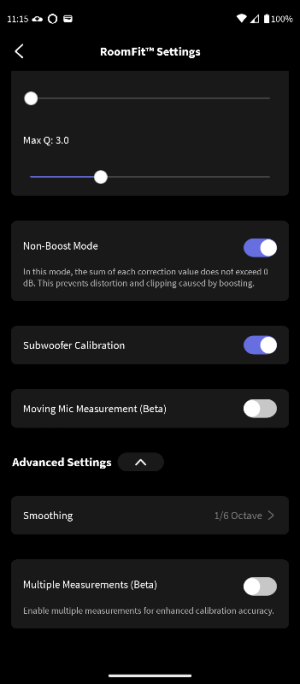
30-400hz
q3
crossover 120hz
single measurement
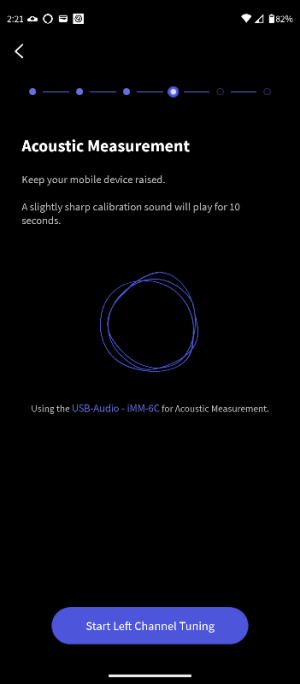
dayton usb C imm 6c calibrated
KEF LSX 2 LT
Linn 10.25 Sizmik Sub
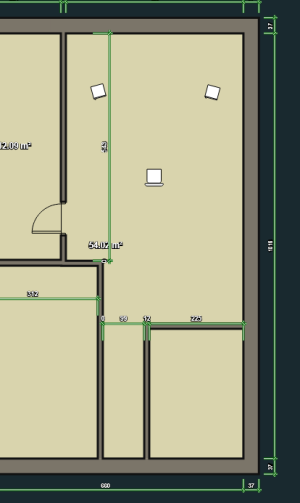
Absorbers placed at all SBIRs
Roomeq Settings:
30-400hz
q3
crossover 120hz
single measurement
dayton usb C imm 6c calibrated
KEF LSX 2 LT
Linn 10.25 Sizmik Sub
Absorbers placed at all SBIRs
Attachments
Last edited: