I used a umik 1 mic and its a night and day difference from my phone mic... Don't forget skeptical!
About that...
So I've been suspicious these cheap measurement mics had some hidden trickery going on in order to be +/- .5dB (per the cal report) over much of the audible spectrum, as has been claimed in this thread.
This morning I downloaded & graphed the reports for my 2 cheap mics (iMM-6 & UMIK-1) and found they are far from flat so I was wrong to conjecture that their errors were corrected by DSP. They would make a very poor choice for any application where the correction file could not be employed.
Edit: swapped jpgs for the pdfs--for those who don't have a pdf viewer app
You are using an out of date browser. It may not display this or other websites correctly.
You should upgrade or use an alternative browser.
You should upgrade or use an alternative browser.
Completed Beta: Room Correction for Android
- Thread starter WiiM Team
- Start date
Beta testing concluded and stable version released to the public builds.
slartibartfast
Major Contributor
- Joined
- Apr 18, 2024
- Messages
- 5,546
You mean a third party app created for the purpose of room equalisation and adwpt.at processing mic calibration files? It is a lot quicker to import a calibration file into REW than create a graph in Excel. I never thought I would see someone choose a bar chart to represent something better suited to a line.
Never thought I'd see anyone trust some 3rd party app over MS Excel.
Nevertheless I'm sure if you fed the same data into each they would produce identical graphs.
Now you have come around to agreeing with everything we have been saying can we just let it lie?
guy48065
Senior Member
- Joined
- Mar 5, 2024
- Messages
- 250
The cluster chart I choose shows each data point and can be verified for accuracy. A line can hide the application of filters and smoothing.You mean a third party app created for the purpose of room equalisation and adwpt.at processing mic calibration files? It is a lot quicker to import a calibration file into REW than create a graph in Excel. I never thought I would see someone choose a bar chart to represent something better suited to a line.
Now you have come around to agreeing with everything we have been saying can we just let it lie?
Look at the crazy data swings above 3k in my iMM-6 graph.
That might be acceptable for limited measurements like RC but people also use these mics for precision work
slartibartfast
Major Contributor
- Joined
- Apr 18, 2024
- Messages
- 5,546
I suppose all imm6s are different. Mine doesn't deviate appreciably until just over 4kHz. I do agree it would be nice to be able to import cal files into the WiiM app.The cluster chart I choose shows each data point and can be verified for accuracy. A line can hide the application of filters and smoothing.
Look at the crazy data swings above 3k in my iMM-6 graph.
That might be acceptable for limited measurements like RC but people also use these mics for precision work
guy48065
Senior Member
- Joined
- Mar 5, 2024
- Messages
- 250
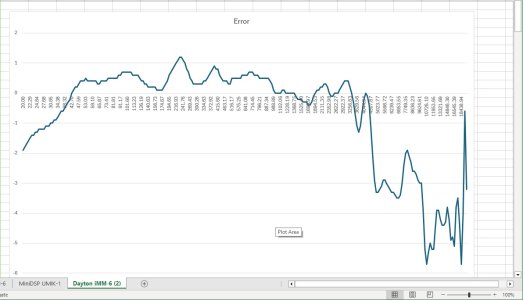
iMM-6 changed to a line graph.
No concerns about 3dB steps within the same octave?
What does REW do with the calibration file? Does it apply point-by-point corrections to the data it collects? What about the in-between steps--like the last 3 data points. Does it use smoothing so data taken in between the cal data points (which are far fewer than what MiniDSP provides) also receive correction?
I'm all about data integrity and just asking questions I haven't seen discussed here.
slartibartfast
Major Contributor
- Joined
- Apr 18, 2024
- Messages
- 5,546
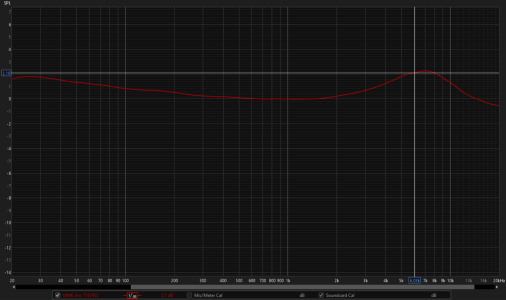
This was my plot of two iMM6 cal files. Mine is in red. I don't know how REW handles the cal files. It probably does use smoothing and interpolation though.View attachment 12464
iMM-6 changed to a line graph.
No concerns about 3dB steps within the same octave?
What does REW do with the calibration file? Does it apply point-by-point corrections to the data it collects? What about the in-between steps--like the last 3 data points. Does it use smoothing so data taken in between the cal data points (which are far fewer than what MiniDSP provides) also receive correction?
I'm all about data integrity and just asking questions I haven't seen discussed here.
Post in thread 'Microphone calibration files' https://forum.wiimhome.com/threads/microphone-calibration-files.4734/post-77912
guy48065
Senior Member
- Joined
- Mar 5, 2024
- Messages
- 250
You dared use ExcelThis was my plot of two iMM6 cal files. ..
This is good stuff.
The emperor is being examined.
What you are really doing is building one of the biggest strawmen in history.I'm all about data integrity and just asking questions I haven't seen discussed here.
There's no secret in what REW does. Data points are data points, no matter what. Any form of interpolation is interpretation. Nothing in your Excel graphs is "more accurate" than what REW shows. And most importantly it's totally irrelevant to the topic at hand.
guy48065
Senior Member
- Joined
- Mar 5, 2024
- Messages
- 250
Wrong.What you are really doing is building one of the biggest strawmen in history.If you want to argue about audio measurements better educate yourself about the state of the art tools.
There's no secret in what REW does. Data points are data points, no matter what. Any form of interpolation is interpretation. Nothing in your Excel graphs is "more accurate" than what REW shows. And most importantly it's totally irrelevant to the topic at hand.
guy48065
Senior Member
- Joined
- Mar 5, 2024
- Messages
- 250
You're projecting.You're making this all about REW vs Excel. This is about the mics.
Excel is the standard for data analysis and is completely transparent to the user. REW is a packaged app and I'm not satisfied it's transparent.
Here's my UMIK cal file. Run it thru REW and see if the presentation is different from what I posted.
Now you post your file that you used in post #706.
Excel is the standard for data analysis and is completely transparent to the user. REW is a packaged app and I'm not satisfied it's transparent.
Here's my UMIK cal file. Run it thru REW and see if the presentation is different from what I posted.
Now you post your file that you used in post #706.
Attachments
guy48065
Senior Member
- Joined
- Mar 5, 2024
- Messages
- 250
It's also good enough for Quality auditors because it's been proven transparent and true countless times for decades.The reason I trust the Excel sheet more is, that we all know, what it does. Input, processing, output. And we got full control over the processing. That's good enough for me
My lab has been through 8 accreditation audits and I've never been faulted for data or software integrity.
If this is not about REW vs. Excel then please won't you insist on Excel being better?You're projecting.You're making this all about REW vs Excel. This is about the mics.
Excel is the standard for data analysis and is completely transparent to the user. REW is a packaged app and I'm not satisfied it's transparent.
I never said that Excel was wrong. I said that the person using Excel can do something wrong when visualising data. If someone posts some picture (!) of an Excel sheet I know just as much about if the data has been processed correctly compare as with an REW screenshot. You might feel more comfortable using your tool than seeing me use mine, but that not the point. Excel is a generic spreadsheet editor, the poor man's analysis tool, not "the standard". In this case it certainly can be used but it's simply not the best tool for the job.
What is the job, anyway?
If it's just about evaluating microphones then we don't even need any visualisation. Just look at the data in the calibration file. If the typical frequency range for EQ needs less then +/- 0.5 dB correction then this is perfect. This is the case with my UMIK-1. If it's within +/- 1 dB it's still good enough. More than that? Not so good, the calibration file should certainly be applied. This is the case with your UMIK-1.
But is this really the job?
Not really, it's not about mics, it's about room correction and how it can be performed in a cost efficient way. This requires us to make measurements. Not trusting REW's representation of the calibration file is totally pointless if you are going to use it for your measurements, anyway. And that takes a bit more than visually displaying a calibration file. Note: Excel won't help here.
You're not going to use REW anyway for WiiM RC? Using the WiiM Home App instead? Well ... even if you could import the cal file already, it is "packaged software", you have no clue what's going on. And in contrast to REW it is not the commonly accepted gold standard, which has developed and matured over countless years.
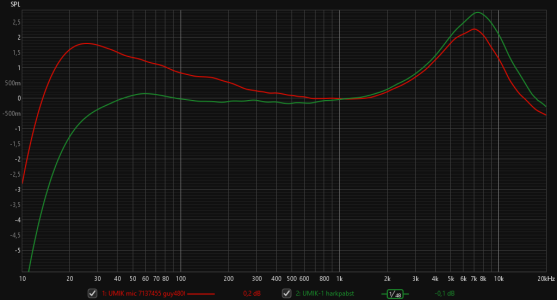
Your bad mic vs. my good mic
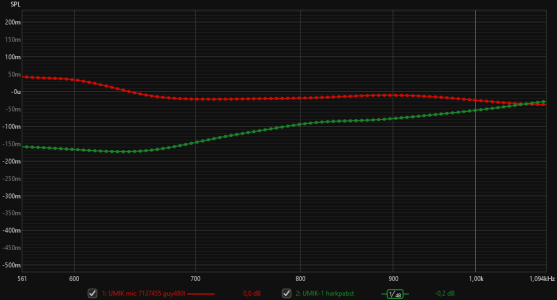
Same, but zoomed in, illustrating the lack of any smoothing (which can be added if you wish to)
Load my calibration file and see if you come to better conclusions than I did.
Attachments
Last edited:
Got my Dayton Audio iMM-6C today and this is the calibration file for it, should someone be interested:
What I don't understand is how to apply this to the auto-EQ, after it has been generated. What does the first line
mean?
And how shall I read the table? When it is minus dB, then I need to add this_value plus dB to the result and vice versa (subtract the positive)?
And are only the frequencies off, that show a result and those without a value are ok?
Code:
*1000Hz    -36.6

20.00    -0.3
20.55    -0.4
21.11    -0.3
21.69    -0.3
22.29    -0.2
22.90    -0.2
23.53    -0.3
24.18    -0.3
24.84    -0.3
25.52    -0.2
26.22    -0.1
26.94    -0.1
27.68    -0.1
28.44    -0.1
29.22    -0.1
30.03    0.0
30.85    0.1
31.70    0.2
32.57    0.2
33.46    0.3
34.38    0.3
35.33    0.3
36.30    0.3
37.29    0.5
38.32    0.6
39.37    0.8
40.45    0.8
41.56    0.8
42.70    0.8
43.87    0.9
45.08    1.0
46.32    1.1
47.59    1.1
48.90    1.1
50.24    1.0
51.62    1.0
53.03    1.0
54.49    1.0
55.99    1.0
57.52    0.9
59.10    0.8
60.73    0.8
62.39    0.7
64.11    0.7
65.87    0.7
67.68    0.7
69.54    0.6
71.44    0.6
73.41    0.5
75.42    0.5
77.49    0.6
79.62    0.6
81.81    0.6
84.05    0.7
86.36    0.7
88.73    0.7
91.17    0.7
93.67    0.7
96.25    0.7
98.89    0.6
101.60    0.6
104.39    0.6
107.26    0.6
110.21    0.6
113.23    0.6
116.34    0.6
119.54    0.6
122.82    0.6
126.19    0.5
129.66    0.5
133.22    0.4
136.87    0.4
140.63    0.4
144.50    0.4
148.46    0.3
152.54    0.3
156.73    0.3
161.03    0.2
165.45    0.2
170.00    0.2
174.67    0.2
179.46    0.2
184.39    0.2
189.45    0.2
194.65    0.2
200.00    0.3
205.49    0.3
211.13    0.3
216.93    0.3
222.89    0.3
229.01    0.3
235.30    0.4
241.76    0.4
248.40    0.4
255.22    0.4
262.23    0.4
269.43    0.4
276.83    0.4
284.43    0.4
292.24    0.4
300.26    0.4
308.51    0.4
316.98    0.4
325.68    0.4
334.63    0.4
343.81    0.4
353.26    0.4
362.96    0.4
372.92    0.4
383.16    0.3
393.68    0.3
404.49    0.3
415.60    0.3
427.01    0.3
438.74    0.3
450.79    0.3
463.17    0.3
475.88    0.2
488.95    0.2
502.38    0.2
516.17    0.1
530.35    0.1
544.91    0.1
559.87    0.1
575.25    0.1
591.04    0.1
607.27    0.1
623.95    0.1
641.08    0.1
658.68    0.1
676.77    0.1
695.35    0.1
714.45    0.2
734.07    0.2
754.22    0.2
774.94    0.2
796.21    0.2
818.08    0.2
840.54    0.1
863.62    0.1
887.34    0.1
911.70    0.0
936.74    -0.0
962.46    -0.0
988.89    0.0
1016.04    -0.0
1043.94    -0.0
1072.61    -0.0
1102.06    -0.1
1132.33    -0.1
1163.42    -0.1
1195.37    -0.2
1228.19    -0.2
1261.91    -0.2
1296.57    -0.2
1332.17    -0.3
1368.75    -0.3
1406.34    -0.3
1444.95    -0.3
1484.63    -0.3
1525.40    -0.3
1567.28    -0.3
1610.32    -0.3
1654.54    -0.3
1699.97    -0.3
1746.65    -0.2
1794.61    -0.2
1843.89    -0.2
1894.53    -0.1
1946.55    -0.1
2000.00    -0.1
2054.92    -0.0
2111.35    -0.0
2169.32    -0.0
2228.89    0.0
2290.10    0.0
2352.98    0.0
2417.59    0.1
2483.98    0.1
2552.19    0.1
2622.27    0.1
2694.27    0.1
2768.26    0.2
2844.27    0.2
2922.37    0.3
3002.62    0.3
3085.07    0.3
3169.79    0.3
3256.83    0.3
3346.26    0.2
3438.14    0.2
3532.55    0.1
3629.56    0.1
3729.22    0.1
3831.62    0.1
3936.84    0.1
4044.94    0.1
4156.01    0.2
4270.14    0.1
4387.39    -0.0
4507.87    -0.3
4631.65    -0.4
4758.83    -0.6
4889.51    -0.7
5023.77    -0.7
5161.72    -0.7
5303.46    -0.7
5449.09    -0.6
5598.72    -0.6
5752.46    -0.5
5910.42    -0.5
6072.72    -0.5
6239.47    -0.4
6410.80    -0.3
6586.84    -0.3
6767.71    -0.3
6953.55    -0.2
7144.49    -0.1
7340.67    -0.0
7542.24    0.1
7749.35    0.2
7962.14    0.3
8180.78    0.2
8405.42    0.2
8636.23    0.1
8873.37    0.1
9117.03    0.1
9367.38    0.1
9624.61    -0.1
9888.89    -0.4
10160.44    -0.6
10439.44    -0.6
10726.10    -0.7
11020.63    -0.7
11323.25    -0.8
11634.18    -0.8
11953.65    -0.9
12281.89    -1.1
12619.15    -1.3
12965.66    -1.4
13321.69    -1.5
13687.50    -1.5
14063.35    -1.6
14449.52    -1.9
14846.30    -2.1
15253.97    -2.4
15672.84    -2.4
16103.21    -2.5
16545.39    -2.8
16999.72    -3.0
17466.52    -3.3
17946.14    -3.6
18438.94    -4.0
18945.26    -4.5
19465.49    -4.7
20000.00    -4.9
What I don't understand is how to apply this to the auto-EQ, after it has been generated. What does the first line
Code:
*1000Hz -36.6And how shall I read the table? When it is minus dB, then I need to add this_value plus dB to the result and vice versa (subtract the positive)?
And are only the frequencies off, that show a result and those without a value are ok?
Similar threads
- Question
- Replies
- 13
- Views
- 2K
- Replies
- 75
- Views
- 2K
- Replies
- 125
- Views
- 7K
- Replies
- 0
- Views
- 1K
- Replies
- 3
- Views
- 177

