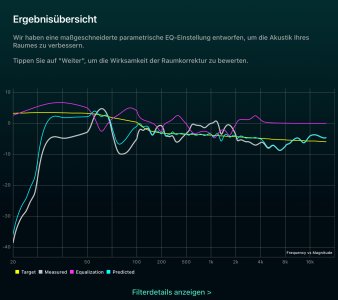
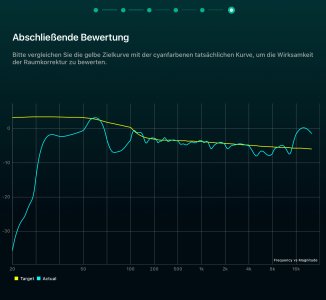
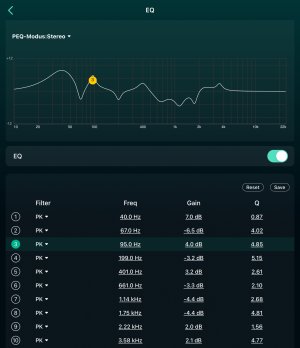
I checked. If the Dayton microphone .cal file has a negative number (-), HouseCurve raises the level (+). If the number is positive (+), then
HouseCurve lowers the level (-).
That's exactly the expected behaviour and exactly the same way REW handles the calibration files.
The first line probably means the volume level at which the microphone has exactly the same characteristics as in the .cal file. So before measuring, you should set the volume so that 1000 Hz is at this level. I have *1000Hz -33.4 (it depends on the shape of the target curve). So you should set the volume to -33.4 dB at 1000 Hz and then the measurement will be accurate.
This question has been answered by Dayton Audio in a somewhat reasonable way, see the link in
post #21. It's not a required level to reach specs, it's just the (baseline) sensitivity at 1 kHz:
Per the product page, (-40 dBV, re. 0 dB = 1V/Pa), thus the reference level would be -40dBV.
It's also in the technical data on Dayton's website, even more precisely:
Sensitivity at 1kHz into 1kohm: 10 mV/PA (-40 dBV, ref. 0dB=1V/PA)
Note by: Just the term "sensitivity" indicates that all of the following values in the calibration files should be given as deviation from the base sensitivity ...
What do these numbers mean? A sound pressure of 1 Pascal RMS is defined as 94 dBSPL (
see e.g. sengpielaudio.com). A sensitivity of -40 dB means that the DA iMM6 will respond with an output voltage of 10 mV RMS to a 94 dB signal (not 1 V RMS). The first line in the cal file gives the
actual value for the
specific mic, which will be somewhat above or below -40 dB.
One example, DA iMM-6 with S/N 99-56230:
*1000Hz -40.3
The true sensitivity of this mic is -40.3 dB at 1 kHz.
In theory, this could be used for accurate measurement of the
absolute sound pressure level. In practice you'd had to have full control over how the mic's output voltage is converted into an dB reading by the hardware and software in use, which is most likely not possible with mobile apps. Luckily, the absolute level doesn't matter much when just dealing with RC.
Calibration files for the iMM-6C show very similar values in their first lines. Not sure if this
is true and trusted information, though. It puts out a digital signal, so we don't care about any voltage, we would want to know the sensitivity relative to 0 dBFS at 94 dB SPL here and -40 dB sounds a little low to me. But I don't have an iMM-6C I could compare to my MiniDSP mics.
Hopefully the guys producing the calibration files know what they are doing.
Amen.
I don't think we can learn much from a lumpy room response. What we need is to compare to a truly flat room response, or a simulated flat input.
Why? The results I got with REW are absolutely in line and clearly show the effect of the calibration file with high precision. See
posting #27.
Even if we got a fresh file form one of those companies offering custom calibration They would still need to tell us how they create their files. Only if their file was (roughly) an inverted version of what Dayton Audio provide this would be an indication of DA doing it in a different, unusual way. But I doubt it.
BTW, REW frequency response measurements do contain the measured data along with the cal file data. You can change the cal file at any later time and directly check the difference. Probably most useful if the original measurement did not contain an actual calibration.
It should be noted that the data points of the measurement will generally not align with those in the microphone calibration. There is no standard for the frequency range, the number of data points or their distribution over the frequency range in a calibration file. On the other hands, the number of data points in a measurement typically depends on the sweep length (when performing swept-since measurements). The default with REW is 256 kB, but you can increase the captured data to up to 4 MB. The distribution of data points is determined by the nature of the Fourier transformation and is not linear over frequency. For that reason, tools like HouseCurve and REW do apply interpolation to the calibration data. For that reason, looking at the graph instead of individual data points is as close to the truth as you can get, except for those data points where the frequencies might match, purely by chance.


