
Hello everyone,
I've been experimenting with RoomFit to correct the low-frequency issues in my room using my KEF LSX II speakers (with their internal EQ disabled) connected to a WiiM Ultra via optical cable. I don't use sub.
I ran three Individual Channel RoomFit sessions and would appreciate the community's analysis and comparison, as I'm not entirely confident in my RoomFit settings and in reading the results graphs and selecting the best profile.
RoomFit configuration:
- Type: Individual Channel RoomFit (my speakers are not placed in center of the room, the left is near the corner and wall layout behind them is also different)
- B&K target curve
- Min-max gain: -12 dB and +6 dB, https://faq.wiimhome.com/en/support/solutions/articles/72000647399 recommends max gain +3 dB but someone on this forum suggested +6 dB when used with non-boost mode, so I followed that
- Max Q: 10
- Non-boost mode: enabled
- Built-in mic compensation: enabled
- Smoothing: 1/12 octave
- Multiple measurements: enabled
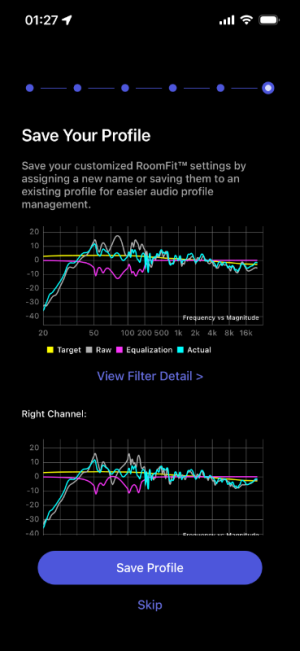
First session (individual400Hz): target frequency is 50-400Hz
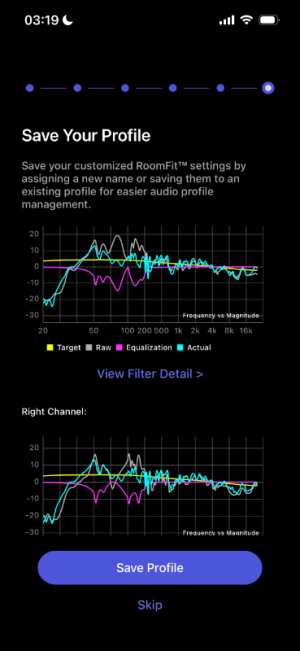
Second session (individual400Hz-2): same freq with first session
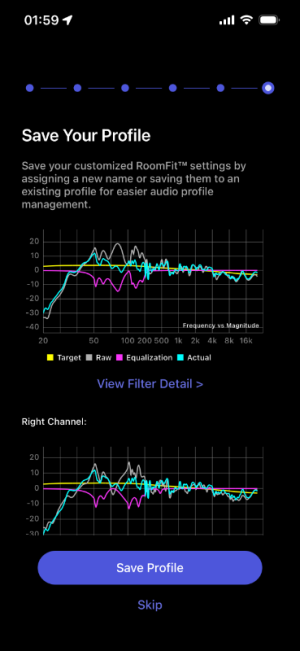
Third session (individual500Hz): target frequency is 50-500Hz
I am very new to this subject, and any advice is welcomed!
I've been experimenting with RoomFit to correct the low-frequency issues in my room using my KEF LSX II speakers (with their internal EQ disabled) connected to a WiiM Ultra via optical cable. I don't use sub.
I ran three Individual Channel RoomFit sessions and would appreciate the community's analysis and comparison, as I'm not entirely confident in my RoomFit settings and in reading the results graphs and selecting the best profile.
RoomFit configuration:
- Type: Individual Channel RoomFit (my speakers are not placed in center of the room, the left is near the corner and wall layout behind them is also different)
- B&K target curve
- Min-max gain: -12 dB and +6 dB, https://faq.wiimhome.com/en/support/solutions/articles/72000647399 recommends max gain +3 dB but someone on this forum suggested +6 dB when used with non-boost mode, so I followed that
- Max Q: 10
- Non-boost mode: enabled
- Built-in mic compensation: enabled
- Smoothing: 1/12 octave
- Multiple measurements: enabled
First session (individual400Hz): target frequency is 50-400Hz
Second session (individual400Hz-2): same freq with first session
Third session (individual500Hz): target frequency is 50-500Hz
I am very new to this subject, and any advice is welcomed!
- 400Hz vs 500Hz range: I am confused about the ideal correction limit. Some advice points to 400Hz as the maximum range for reliable room correction, while others suggest 500Hz is safe for low-frequency room mode correction. Which cutoff is technically more appropriate for this purpose?
- How successful was Roomfit in correcting the Hz across all profiles? (I can't say which cyan curve is better than which)
- Will an external microphone improve further the correction? I've been using the iphone 13 mic at 3 am for absolute silence lol
")

 Thank you!