slartibartfast
Major Contributor
- Joined
- Apr 18, 2024
- Messages
- 1,989
Where would these DSP chips get their power supply from? The iMM6 only has four connections. Mic, Left and Right audio out and ground.Never said anything of the sort.
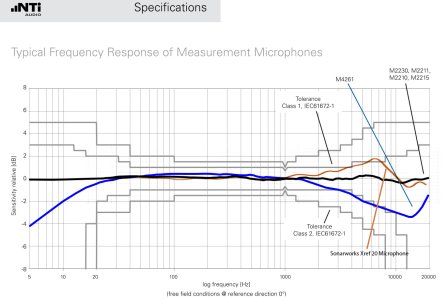
It's a fact that true measurement microphones that measure flat--and have traceable certificates to prove it--do NOT employ DSP. They are expensive because it's actually quite difficult to get flat response 20-20k.
I'd just like to know how Dayton & MiniDSP do it for $39 & $79.
I assume they use cheap DSP chip to correct the major flaws, and supply a deviation sheet so the end user can correct the remaining error.
You two assume their mics are made of fairy dust and provide $1000 performance for $79.
I'm sorry but I'm a realist and suspect things aren't as simple as you assume.
Ultimately it doesn't matter to most. They're certainly more flat than most uncorrected rooms.